


The .NET Application Performance Monitoring (APM) template of the next big technology app development company 2023 helps you monitor Internet Information Services (IIS)-hosted .NET applications from server- and client-side perspectives. It makes you find details about application performance and reliability that can pinpoint the root causes of incidents. When specifying settings like collecting types of events, measuring performance goals, and monitoring servers determine how these applications are running. You can analyze the number of times problems occur and how a server performed during these times along with the chain of events related to the slow request or method that is raising exceptions. This information should be combined with software developers and database administrators to ensure that applications perform correctly and reliably for your customers.
.NET applications let you monitor various other applications and web services that are hosted in Internet Information Services (IIS) 7.0. You can choose mobile application development solutions or services discovered by the IIS 7.0 management pack and browse performance monitoring and exception events. For this, you need to monitor applications and web services.
Table of Contents
Features to examine .NET monitoring tools in the market are as follows:
1. Retrace
Retrace is an APM that goes beyond monitoring. It has a .NET agent that evaluates the tech stack of your application. Also, it has its own Retrace App Score. According to the Apdex, it helps you assess the overall performance of your application. Basically, the app store serves as the overall performance indicator. Retrace your work with .NET and .NET core applications, and it supports several web and cloud technologies like SQL Server, Oracle, PostgreSQL, MySQL, MongoDB, Elastic search, Redis, AWS, and Azure.
Also read : Java Vs .Net Vs Python – Which One Is Best to Choose?
Developers of top app Development Company in India find that retrace is a feature-rich APM and deal with logs. It provides quick and easy log aggregation across different applications and servers. For instance, developers can view and search across different apps and server logs. Users can easily navigate into full-transaction tracing from a log statement. Aside from its efficient log tagging and analysis, it also offers structured logging. Logs have a specific format for .NET monitoring with automated log query configuration and monitoring.
2. .NET Memory Profiler
The .NET Memory Profiler is a robust monitoring tool that helps you find memory leaks. It runs memory usage in C#, VB.NET, or any other .NET Language applications. Development experts can use its profiling guides, automatic memory analyzer, and specialized trackers. These fundamental features ensure that there are no memory or resource leaks and further ensure that memory usage is as optimized as possible.
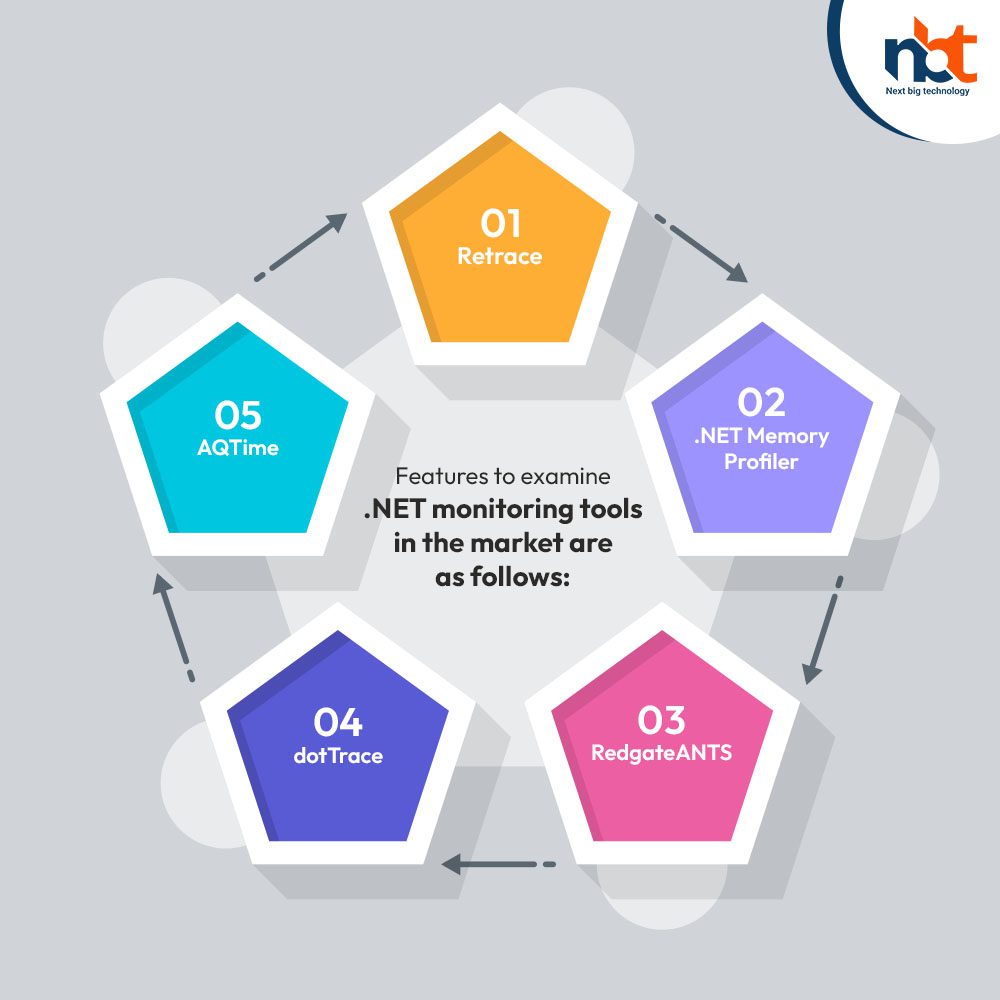
3. RedgateANTS
RedgatesANts is considered the most popular web development trend that considers the slowest activity in your application. It has a call tree for .NET performance profiling that analyzes data for every method.
- Identifies expensive database methods, queries, and web requests– This featured-rich tool determines C# and other .NET languages in a sequential manner. Similarly, it lowers code analysis with line-level timings. Find issues at a single look using the precise timing of data. It automatically highlights complex code for quick visual inspection.
- Examine your code’s database interactions– This .NET monitoring tool examines how your .NET code makes database queries and further provides information on how these queries perform. Also, this tool supports SQL Server and Oracle databases (local or remote).
- Capture outgoing web requests– It harnesses all outgoing HTTP requests to collect data about request and response headers. Similarly, it lets next big technology app development company 2023 identify what .NET function or method caused all these requests.
- Profile SQL queries– Examine the timings for the specific lines of .NET code. The SQL execution plans look for resolutions based on why a particular SQL query is running slow.
4. dotTrace
The dotTrace monitoring tool encounters performances based on different .NET and .NET Core applications like Windows Presentation Foundation (WPF) and Universal Windows Platform, ASP.NET, Windows services, Windows Communication Foundation (WCF) services, etc.
Some extensive features include performance analysis issues, Profile SQL queries and HTTP requests, Profile static methods and unit tests, Profile and analysis results right in Visual Studio, etc.

5. AQTime
Memory leaks are always a daunting activity for developers. AQTime is a profiling and monitoring mobile application development solutions for mission-critical applications. It aims at memory and code coverage that hinders your .NET application’s performance. Nobody denies the fact that AQTime detects memory leaks quickly to easily pinpoint performance bottlenecks and code coverage gaps. Its actionable reports simplify complex memory and performance information and help developers with easy bug analysis workflows. Developers can explore and find the root of the problem right away.
Some excellent features to enhance the application’s performance of AQTime include .NET Profiling, Performance Profiler, Code Coverage Profiler, Memory Leaks Detection, C/C++ Code Profiling, Visual Studio & RAD Studio Integration, Microsoft Visual Studio, and Embarcadero RAD Studio for better productivity, Intuitive Reporting, and more.
Also read : ASP.NET vs PHP – What to Choose for Your App Needs
Conclusion
Creating a robust application is an important activity that involves many person-hours to do complex coding such as HTML, CSS, and JS. Application development includes various libraries, mapping entities, database connectivity, server response time, and a lot more.
.NET monitoring is an essential part of .NET application development. Top app development company in India allows developers to track the health and well-being of their applications and further provide real-time performance reviews. Knowing the real status of your application ensures that users have complete access to your business website.
.NET monitoring ensures that your business is not impacted by any kind of application issues. For instance, problems experienced during site navigation can discourage customers from making a purchase from your website.
During this process, it becomes critical to understand the exact cause that is slowing down the application. Therefore, the tools and software mentioned above are helpful to make the process easier in terms of debugging, monitoring, and optimizing the performance of the application.
Thanks for reading our post “What are the top tools of stack Microsoft Net Application to monitor performance? “, please connect with us for any further inquiry. We are Next Big Technology, a leading web & Mobile Application Development Company. We build high-quality applications to full fill all your business needs.