


Educational institutions now face a growing need to understand how students learn. Modern digital systems help schools track progress over time. These tools offer a powerful tool to drive student success in every classroom.
This technology turns raw numbers into clear visuals for better clarity. It allows teachers to create improved strategies for student success. Using a modern Analytics Dashboard ensures no learner falls behind while others excel.
Schools use these insights to improve their overall teaching methods. Transforming raw data into academic insights is no longer optional for top-tier schools today.
Reliable metrics offer a path to better grades and higher graduation rates. This holistic approach boosts the quality of education across the entire campus.
Table of Contents
Key Takeaways
- Identify learning trends with high accuracy.
- Drive student success through data-driven choices.
- Transform raw numbers into meaningful insights.
- Support smarter decision-making for school leaders.
- Create targeted teaching strategies for every student.
- Boost overall graduation rates and grade averages.
Understanding Academic Performance Analytics Dashboards
Academic Performance Analytics Dashboards are key in today’s schools. They give teachers and leaders a full view of how students are doing. This is done by using data from many places.
Definition and Purpose
An Academic Performance Analytics Dashboard is a tool that shows data from different places. It makes it easy to see how students are doing. This helps teachers make better choices based on data-driven decision-making.
Evolution of Educational Data Systems
Educational data systems have changed a lot. They used to just store basic student info. Now, they are complex tools that help teachers understand data better.
The change is shown in the table below:
| Era | Characteristics | Key Features |
|---|---|---|
| Early Systems | Basic student information storage | Simple databases |
| Modern Systems | Advanced data analytics and visualization | Real-time data processing, predictive analytics |
The Role in Modern Education
In today’s schools, dashboards are very important. They help improve how well students do. Experts say, “Data analytics is now a must for schools to boost student success.”
“Using data analytics well can really help students learn better. It offers tailored learning plans and helps catch problems early.”

Core Components of Academic Performance Analytics Dashboard
An Academic Performance Analytics Dashboard works well because of its key parts. These parts help make decisions based on data in schools. They give teachers and leaders a full view of how students are doing. This helps spot where students need help and how to help them.
Data Visualization and Graphical Interfaces
Good data visualization is key for making hard data easy for teachers and leaders to understand. Data Visualization makes data clear and useful.
Charts and Graphs
Charts and graphs are basic tools for showing student performance data. They help people see trends and patterns fast.
Heat Maps and Trend Lines
Heat maps and trend lines give more insight into how students are doing. For example, a heat map can show where students are having trouble.

Real-Time Data Processing
Real-Time Data Processing is very important. It lets teachers quickly respond to new trends and problems. Tools like Knowi help make dashboards that track student and school performance as it happens.
“The use of real-time data analytics in education enables institutions to make timely interventions, improving student outcomes and institutional effectiveness.”
Reporting and Export Capabilities
Reporting Capabilities are key for sharing findings with others. Being able to make and share reports helps get data insights to parents, leaders, and others.
| Component | Functionality | Benefit |
|---|---|---|
| Data Visualization | Presents complex data in an accessible format | Enhances understanding of student performance |
| Real-Time Data Processing | Provides up-to-the-minute insights | Enables timely interventions |
| Reporting and Export Capabilities | Facilitates the generation and sharing of reports | Supports stakeholder communication |
Critical Performance Metrics and Indicators
It’s key to know the important performance metrics and indicators for an Academic Performance Analytics Dashboard. These help teachers and school leaders make smart choices about helping students and using resources well.
Academic Achievement Measures
Academic achievement shows how well students do in school. It shows if they meet school standards and how they’re doing overall. Important measures include:
Grade Point Averages
Grade Point Averages (GPA) give a full picture of a student’s grades over time. By watching GPA, teachers can spot trends and help when needed.
Test Scores and Assessments
Standardized test scores and assessments are key to knowing how students are doing. Looking at these scores helps teachers see where students might need extra help or where the curriculum needs to change.
Attendance and Participation Rates
Attendance Rates show how engaged students are and if there are any problems. If students don’t come to school much, it might mean they need help. Participation rates in class and outside activities also show how students are doing socially and in school.

Behavioral and Social-Emotional Data
Behavioral and social-emotional data give insights into students’ lives outside of school. This includes things like disciplinary actions, how they interact with others, and their emotional health. By looking at this data, teachers can create plans to help students succeed in all areas.
By focusing on these key metrics and indicators, schools can use their Academic Performance Analytics Dashboard to the fullest. This helps improve how well students do in school.
Benefits for Educational Institutions
Academic Performance Analytics Dashboards are changing education. They give schools useful insights. These dashboards help improve education quality and make schools more efficient.
Data-Driven Decision Making
One big plus of these dashboards is data-driven decision making. They offer real-time data and analytics. This helps teachers and leaders make smart choices based on facts, not guesses.
Resource Optimization and Budget Allocation
For schools, resource optimization is key. These dashboards help by analyzing how well resources are used. This way, schools can better use their budgets.
Early Warning Systems for At-Risk Students
Early warning systems are another big plus. They keep an eye on how students are doing. This lets teachers help students who might struggle early on.
Improved Accountability and Transparency
These dashboards also help with improved accountability and transparency. They make it easy for everyone to see how schools are doing. This builds a culture of openness and responsibility.
Academic Performance Analytics Dashboards offer many benefits. They help with making better decisions, using resources wisely, and spotting students who need help. As more schools use these tools, they will likely see better results for students and better school operations.

- Enhanced decision-making capabilities
- Optimized resource allocation
- Early identification of at-risk students
- Increased transparency and accountability
Empowering Teachers with Dashboard Insights
Teachers now have actionable insights thanks to Academic Performance Analytics Dashboards. This helps them better support individual students. They can understand student performance deeply, leading to more effective teaching.
Individual Student Performance Tracking
Tracking individual student performance is key in these dashboards. Tools like Knowi let teachers see each student’s progress. They can spot strengths and weaknesses, making sure no student is left behind.
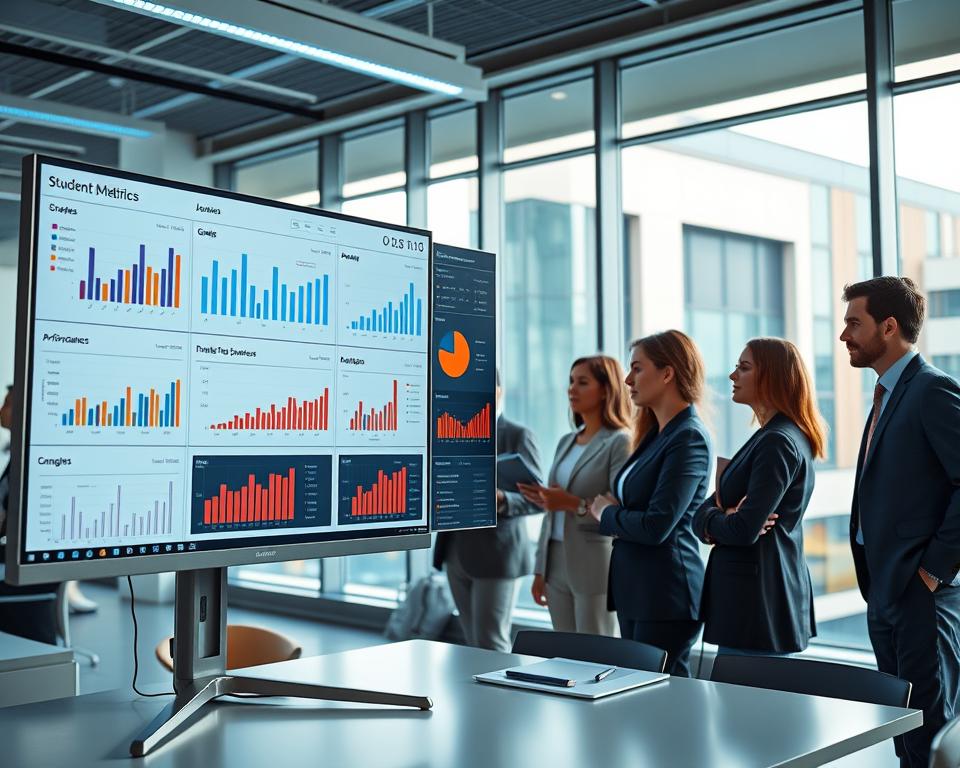
Class-Wide Trend Analysis
These dashboards also help with class-wide trend analysis. Teachers can see how the whole class is doing. They can then adjust their teaching to meet everyone’s needs, creating a better learning space.
![]()
Personalized Learning Interventions
Teachers can use these insights for personalized learning interventions. They can tailor lessons to fit each student’s needs. This way, students get the help they need to do well.
Parent Communication Enhancement
Lastly, these dashboards improve parent communication. Teachers can share detailed reports with parents. This keeps parents in the loop, helping everyone work together for student success.
Academic Performance Analytics Dashboards empower teachers with valuable insights. They are crucial in modern education, leading to better student results and teaching methods.
Administrative Applications and Strategic Planning
Educational institutions aim for excellence, making Academic Performance Analytics Dashboards crucial. These dashboards help teachers and offer big benefits for administrators. They guide strategic planning and decision-making.
District-Wide Performance Monitoring is key. Dashboards give a clear view of performance across schools and districts. This helps administrators spot strengths and weaknesses. Knowi’s solution, for example, makes tracking progress easier.
District-Wide Performance Monitoring
Administrators can watch district-wide performance in real-time. This lets them quickly spot trends and areas needing help. It’s vital for keeping education standards high.
Program Evaluation and Effectiveness
Program Evaluation and Effectiveness is another big use. Dashboards help administrators see how programs work. They can decide where to put resources and what to keep or cut.
“Data-driven decision-making is the future of education,” experts say. They stress the need for using data analytics in program evaluation.
Accreditation and Compliance Reporting
Accreditation and Compliance Reporting gets easier with these dashboards. They create reports and provide data for accreditation. This saves staff a lot of work.

Using these tools, schools can work better and plan smarter. This leads to better learning outcomes and smarter use of resources.
Data Sources and Integration Points
An Academic Performance Analytics Dashboard works best when it can pull data from many places. It combines data from different educational systems to show how students are doing overall.
To do this, the dashboard needs to work with several important systems. One key source is the Student Information Systems (SIS). SIS lets data like student details and enrollment move smoothly. This is key for understanding how students are doing.
Student Information Systems Integration
SIS integration is key for getting a basic set of data. It includes student profiles, attendance, and other important info. This helps put student performance into context.
Learning Management System Data
Learning Management Systems (LMS)
are also crucial. They hold lots of info on how students interact with learning materials. By linking LMS data, teachers can see where students might need help.

Assessment Platform Connections
Assessment platforms are important for tracking how well students do in tests and quizzes. Adding this data to the dashboard lets teachers see how students are improving over time.
External Educational Applications
But there’s more. Academic Performance Analytics Dashboards can also link up with other educational tools. This could include special education resources or tracking for extracurricular activities. By bringing in all these different sources, teachers get a deeper look at how students are doing.
Tools like Knowi make it easy to connect with various data sources. This includes SIS, LMS, and assessment platforms. It makes the dashboard more useful and gives a clearer picture of student performance.
Essential Features of High-Performing Analytics Platforms
An Academic Performance Analytics Dashboard works best when it gives clear, useful insights. Top analytics platforms have key features that help schools get the most out of their data.
Customizable User Interfaces
A customizable user interface lets educators and admins make the dashboard fit their needs. This makes it easier to use and boosts productivity. For example, Knowi’s platform has customizable user interfaces for different roles in schools.
Predictive Analytics and Forecasting
Predictive analytics is key for seeing what’s coming next. It helps schools:
- Risk Prediction Models spot students at risk of failing or dropping out.
- Success Probability Indicators show how likely students are to succeed in school.
With these tools, teachers can focus on helping students who need it most. For more on making custom analytics dashboards, check out this guide.
Role-Based Access and Permissions
Role-based access controls keep sensitive info safe. Only the right people can see it. This is important for keeping student data secure.
Mobile Accessibility
In today’s world, mobile accessibility is a must. It lets people check important data anytime, anywhere. This is key for making quick decisions.

Implementation Planning and Deployment Strategies
To get the most out of an Academic Performance Analytics Dashboard, schools need to plan carefully. They must tackle the unique challenges of education with a detailed approach.
Conducting a Comprehensive Needs Assessment
A good start is a thorough needs assessment. It helps figure out what data is needed, who will use it, and what systems are already in place. For example, CodePex ERP offers a risk-free trial, showing the value of careful planning.
Stakeholder Engagement and Buy-In
Getting everyone involved is key. This includes teachers, principals, and IT staff. Their support is vital for making sure the dashboard works well for everyone.

Phased Rollout Approaches
Starting small with a phased rollout is smart. It lets schools test and tweak the dashboard before it goes live. This way, they can fix problems before they affect everyone.
Training and Professional Development
Good training is crucial. It helps users get the most out of the dashboard. Schools should offer ongoing support to keep everyone up-to-date.
By focusing on these steps, schools can make the most of their Academic Performance Analytics Dashboard. This leads to better student results and smarter choices.
Technical Infrastructure and System Requirements
To get the best results, it’s key to check the technical setup and system needs for Academic Performance Analytics Dashboards. A good infrastructure helps the dashboard work well, grow, and stay reliable.
Hardware and Network Specifications
The dashboard needs the right hardware and network setup to run smoothly. Enough server power, memory, and network speed are crucial. They help manage the data and user traffic well.
Cloud-Based versus On-Premise Deployment
Choosing between cloud-based and on-premise deployment is important. Cloud options, like Knowi’s, offer scalability and flexibility. On-premise solutions give more control over data security.
Scalability Considerations
Scalability is key to meet growing data needs. A scalable system lets the dashboard handle more users and data without slowing down.
Experts say, “A scalable infrastructure is essential for an Academic Performance Analytics Dashboard’s long-term success.”
“The right technical infrastructure is the backbone of any successful analytics implementation.”
Data Privacy, Security, and Compliance
As schools use Academic Performance Analytics Dashboards more, keeping student data safe is key. This data is very personal and needs strong protection. Schools must stop unauthorized access and data breaches.
FERPA Regulations and Requirements
The Family Educational Rights and Privacy Act (FERPA) protects student records. Schools must follow FERPA to keep Academic Performance Analytics Dashboards safe. They must protect personal info and control who sees student records.
Data Encryption and Protection Protocols
Data encryption is vital for keeping data safe. It makes data unreadable to stop unauthorized access. Schools need strong encryption for data stored and in transit. Here are some important data protection methods:
| Protocol | Description | Importance |
|---|---|---|
| SSL/TLS Encryption | Encrypts data sent between client and server | High |
| Database Encryption | Encrypts data in databases | High |
| Access Controls | Limits access to authorized people | High |
User Authentication and Authorization
Strong user authentication and authorization are crucial. They make sure only the right people see student data. This includes multi-factor authentication and regular checks on who can access what.
Ethical Considerations in Data Analytics
Schools must think about the ethics of using student data too. They should be clear about how they use data and make sure it’s accurate. They should also avoid biases in their analysis. For more on using data analytics, check out Next Big Technology for info on AI in tracking employee performance.
Overcoming Implementation Challenges
Institutions are working hard to use data for better decisions. They face many challenges when setting up Academic Performance Analytics Dashboards. These challenges need to be tackled for success.
Addressing Data Quality Issues
Ensuring data quality is a big challenge. Data Quality is key for making good decisions. Without it, decisions can be wrong.
Studies show that good data is essential in schools. It helps make informed choices for better decision-making.
Managing Change Resistance
Introducing a new dashboard means big changes. It’s important to manage Change Resistance well. This means explaining the dashboard’s benefits and training users.
Solving Integration Complexities
Integration Complexities happen when combining data from different sources. Schools need to make sure their dashboard works well with other systems.
Ensuring Sustainable Adoption
For the dashboard to last, it needs to be adopted for the long term. This means ongoing support, updates, and training for users.
| Challenge | Strategy |
|---|---|
| Data Quality Issues | Implement data validation and cleansing processes |
| Change Resistance | Communicate benefits and provide training |
| Integration Complexities | Ensure compatibility with existing systems |
| Sustainable Adoption | Provide ongoing support and updates |
Best Practices for Maximizing Dashboard Value
To get the most out of an Academic Performance Analytics Dashboard, schools need a smart plan for data use. They should focus on using data to make better choices and improve. This means following some key steps to make sure the dashboard helps.
Establishing Regular Data Review Cycles
It’s important to check data regularly to find trends and see how things are changing. Schools should pick a schedule, like weekly or monthly, to review the dashboard. CodePex ERP and Knowi say it’s key to check data often.
This helps teachers and leaders keep up with how students are doing. They can act fast if needed.
Converting Data into Actionable Strategies
The main goal of an Academic Performance Analytics Dashboard is to use data to make things better for students. Schools should look at data, find problems, and plan how to fix them. They should also use resources wisely.
- Find important areas that need work.
- Make plans based on data to help.
- Check if these plans are working.
Creating Feedback Loops for Continuous Improvement
Feedback loops are key to making sure data leads to ongoing betterment. It’s not just about using data, but also checking how well it works. Then, make changes as needed.
Continuous improvement happens when data is checked often. This leads to better strategies over time.
Fostering a Data-Informed Culture
Creating a culture that values data is vital for an Academic Performance Analytics Dashboard. Schools should teach staff to use data well. They should also encourage making choices based on data.
By supporting a data-focused culture, schools can make sure their dashboard is used fully.
Success Stories and Practical Applications
Academic Performance Analytics Dashboards have made a big difference in schools and colleges. They help make better decisions based on data. This leads to better student results and more effective schools.
K-12 District Transformation Examples
K-12 schools have seen big improvements with these dashboards. They help students do better and make things easier for teachers. Knowi shows how their platform works well in K-12 settings.
One school district used the dashboard to find students at risk. They helped these students, and it really paid off. Dropout rates went down, and grades went up.
Higher Education Analytics Implementations
Colleges and universities use these dashboards to help students succeed. They look at how students do, how engaged they are, and who they are. This helps them create plans to help students do their best.
A university used a dashboard to see how students were doing. They found out who needed extra help. This led to better support for students and more of them staying in school.
Special Education and Intervention Programs
These dashboards are great for special education too. They help track how students are doing and adjust help to fit each student’s needs. This way, teachers can make better choices about how to teach and support students.
Career and Technical Education Tracking
Career and technical education (CTE) programs also benefit from these dashboards. They help see how students are doing in CTE classes. This lets teachers know who needs extra help and how to make the program better.
| Education Level | Application | Outcome |
|---|---|---|
| K-12 | Identifying at-risk students | Decrease in dropout rates |
| Higher Education | Tracking student progress | Improved student retention |
| Special Education | Tailoring interventions | Improved student outcomes |
| Career and Technical Education | Tracking program effectiveness | Improved program outcomes |
Emerging Trends and Future Developments
The future of educational analytics is changing fast. Technology is getting better, making it easier for schools to use data to make smart choices.
Artificial Intelligence and Machine Learning Integration
Companies like Knowi are adding Artificial Intelligence (AI) and Machine Learning (ML) to their tools. This means dashboards will soon be able to understand and use complex data better. They will spot trends and offer advice on how to teach better.
Advanced Predictive Modeling
Advanced Predictive Modeling is also on the rise. It uses past data and math to guess how students will do. This helps teachers help students early on, making learning better for everyone.
Unified Student Success Ecosystems
The idea of Unified Student Success Ecosystems is becoming popular. It combines different data sources to give a full picture of how students are doing. This helps teachers see where students need extra help.
Natural Language Processing for Insights
Natural Language Processing (NLP) is being used to understand things like student feedback. It gives insights into what students really think and feel.
These new trends are going to change educational analytics a lot. They will help schools support students better and improve learning outcomes.
Selecting the Right Analytics Dashboard Solution
Choosing the right analytics dashboard is key for schools wanting to make better decisions with data. It’s about looking at many factors to make sure the solution fits the school’s needs and goals.
Vendor Evaluation Criteria
When looking at vendors, schools should focus on a few important things. Functionality and feature sets are key. They show if the dashboard can meet the school’s specific needs.
- Data visualization capabilities
- Real-time data processing
- Customizable reporting
Functionality and Feature Sets
The dashboard should be easy to use and customizable. It should work well for different roles in the school.
Cost and Total Ownership
Schools need to look at more than just the upfront cost. They should also think about ongoing costs like maintenance and support.
“A thorough cost analysis is essential to avoid unexpected expenses down the line,” says an education technology expert.
Support and Training Services
The support and training from the vendor are crucial. Good support and training help the dashboard get used well in the school.
Pilot Testing and Proof of Concept
It’s wise to test the dashboard before deciding. CodePex ERP and Knowi offer trials and proof of concept. This shows how important it is to evaluate vendors well.
Scalability and Future-Proofing
Scalability is also important. A good solution can grow with the school. It should handle more data and changing needs over time.
Conclusion
The use of Academic Performance Analytics Dashboards is changing education. It helps make decisions based on data at all levels. This means schools can improve student success and work better as a whole.
We’ve looked at how Academic Performance Analytics works. It includes key parts and metrics, and it helps schools and administrators. These dashboards let teachers see how students are doing and find ways to help them improve.
As schools keep using these tools, they can do even better. They can help students succeed more and work better as a school. By using data to make decisions, teachers can make a big difference in education.