






Managing infrastructure costs across AWS, Azure, and Google requires clear visibility. Many teams face fragmented data, making it hard to track real spending patterns.
This guide shows how to build cloud cost dashboard tools for a unified view. You will learn to centralize usage metrics, budgets, and anomaly alerts in one interface.
We begin by defining key business questions and building a strong data architecture. Next, we examine cloud cost monitoring methods that keep financial data accurate and useful. This framework helps you improve reports and make better optimization decisions over time.
Table of Contents
Key Takeaways
- Centralize financial data from AWS, Azure, and Google for a complete view.
- Define specific business questions before designing your data architecture.
- Implement automated anomaly detection to prevent unexpected budget spikes.
- Ensure data integrity by validating totals against native provider reports.
- Establish strict access governance to keep sensitive financial information secure.
Define the Dashboard’s Goals, Users, and Cost Questions
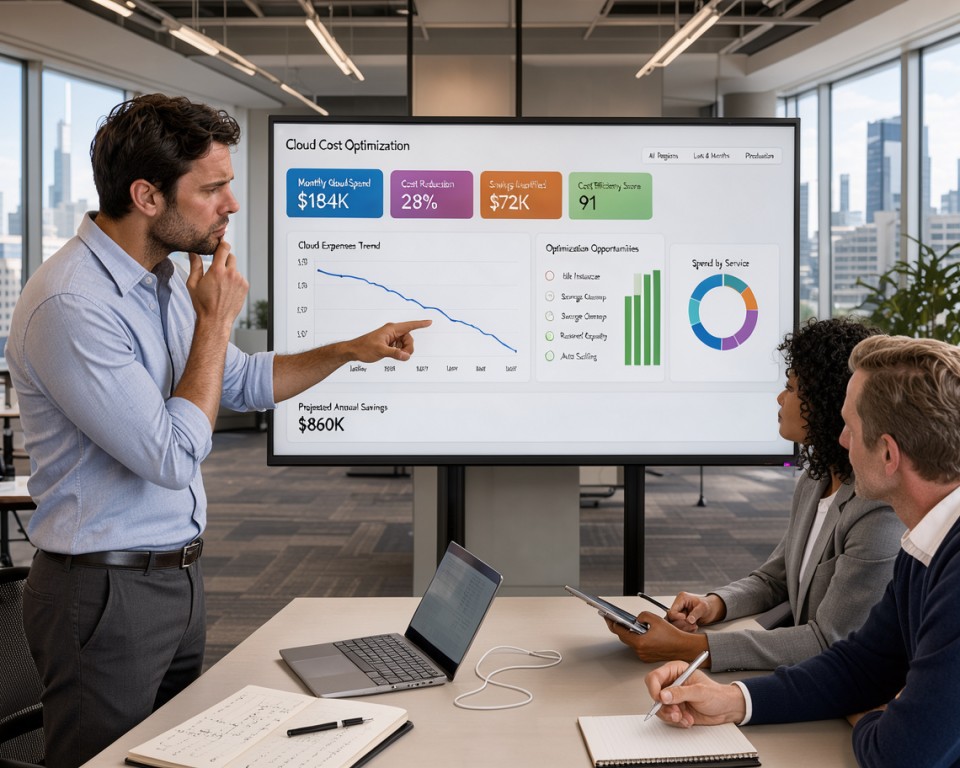
Set goals early so your cloud cost optimization efforts stay focused and useful. A dashboard does more than show charts; it helps departments work toward shared financial targets. Identify primary users first, then tailor the interface to the insights they need for better decisions.
Identify the Decisions the Dashboard Must Support
Your dashboard should help stakeholders take specific actions, not simply watch numbers. For example, engineering teams need to know whether a recent deployment caused a compute cost spike. Finance teams need data to adjust quarterly forecasts using actual run rates.
Decisions often focus on budget ownership and resource lifecycle management. Build the dashboard around these choices to shift from passive monitoring to active cost management. This approach gives every metric a clear purpose in your daily workflow.
Assign Responsibilities Across Finance, Engineering, and Operations
Successful cloud cost optimization depends on clear responsibilities. Finance usually manages the overall budget and variance analysis. Engineering focuses on resource efficiency and architecture changes, while Operations manages tagging policies and infrastructure automation.
This table shows how these groups use the dashboard to answer their specific questions:
| Stakeholder | Primary Focus | Key Question |
|---|---|---|
| Finance | Budget Compliance | Are we on track to meet our quarterly spend targets? |
| Engineering | Resource Efficiency | Which services are driving our current usage spikes? |
| Operations | Governance | Are all resources tagged correctly for accurate billing? |
Set Baseline Objectives for Visibility, Waste Reduction, and Budget Control
Clear objectives help you measure progress over time. Aim for total visibility into your cloud footprint, so every resource appears in your reports. This transparency helps you find waste, including idle instances and unattached storage volumes.
Set firm budget control goals to prevent unexpected overages. Tracking these baselines turns your dashboard into a proactive engine for cloud cost optimization. Your team can then manage the bottom line instead of simply watching the bill.
Choose a Cloud Cost Data Architecture
A strong cloud cost data architecture turns complex provider invoices into useful business insights. Build this foundation early to keep financial reports accurate as your infrastructure grows.
Map Billing Data From Amazon Web Services, Microsoft Azure, and Google Cloud
Each major provider uses a different usage report format. Ingest raw cloud billing data from AWS Cost and Usage Reports (CUR), Azure Consumption APIs, and Google Cloud Billing exports.
Standardizing these sources creates one clear view. Map their fields to a common schema matching your internal cost centers and business units.

Decide Between Native Cost Tools and a Centralized Data Warehouse
Choose the storage layer based on your reporting needs. Native tools are easy to start, but a centralized data warehouse gives greater flexibility for complex analysis.
| Feature | Native Tools | Data Warehouse |
|---|---|---|
| Complexity | Low | High |
| Freshness | Delayed | Near-Real-Time |
| Ownership | Provider | Internal |
Design Data Pipelines for Daily and Near-Real-Time Reporting
Automated pipelines move cloud billing data from the source to your reporting layer. They should handle ingestion, transformation, and loading (ETL) efficiently.
Near-real-time reports help teams respond quickly to spending spikes. Automation is key because it reduces manual work and keeps your dashboard current with usage patterns.
Handle Currency, Time Zones, Credits, Refunds, and Taxes Consistently
Inconsistent treatment creates conflicting totals and weakens trust in your dashboard. Define standardized logic for currency conversion and time-zone alignment across all providers.
Also, classify credits, refunds, and taxes correctly within your cloud cost data architecture. Treat these items consistently to prevent hidden costs from distorting monthly budget forecasts.
Establish a Reliable Cloud Resource Tagging Strategy
A robust cloud resource tagging strategy turns raw billing data into useful business insights. Consistent labels show exactly where your infrastructure money goes. This visibility supports a successful financial operations program.

Define Required Tags for Teams, Applications, Environments, and Owners
To maintain order, standardize your metadata schema across the organization. Each resource should carry required tags that show its business context. These tags help finance and engineering teams use the same language when reviewing monthly spending.
Consider these core tags to ensure full accountability:
| Tag Name | Purpose | Example Value |
|---|---|---|
| Team | Identifies the cost center | Data-Engineering |
| Application | Links spend to a product | Customer-Portal |
| Environment | Distinguishes lifecycle stage | Production |
| Owner | Defines point of contact | j.smith@company.com |
Separate Cost Allocation Tags From Operational Metadata
Separate tags for financial reports from tags for technical operations. Keep Cost allocation tags stable and consistent, so reporting models do not break. Operational metadata, such as patch versions or backup schedules, can change often without affecting budget views.
“Governance is not about restricting innovation; it is about providing the structure that allows innovation to scale without hidden costs.”
Enforce Tagging With Amazon Web Services, Microsoft Azure, and Google Cloud Policies
Manual tagging often causes human error and inconsistency. Use native cloud policies to enforce cloud resource tagging and prevent deployments without required labels. Amazon Web Services Service Control Policies, Azure Policy, and Google Cloud Organization Policy Service are powerful tools for this purpose.
Track Untagged Resources as a Visible Governance Metric
Even with strict policies, some resources may escape detection. Treat untagged assets as a measurable governance issue, not only a technical oversight. A dashboard showing “unallocated spend” gives teams a clear reason to fix tagging gaps quickly.
How to Build Cloud Cost Dashboard Data Models
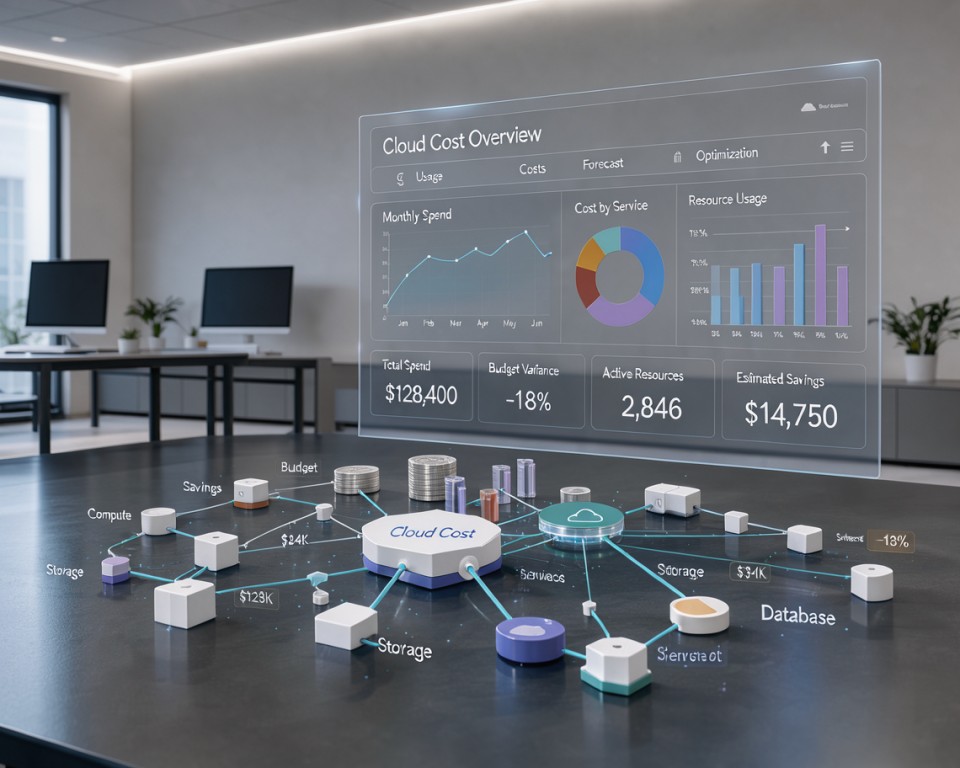
A well-designed cloud cost data model links raw billing files to useful business insights. It turns complex provider invoices into a clear story about infrastructure spending. This foundation helps your team find the specific drivers behind every dollar spent.
Create Fact Tables for Usage, Charges, Budgets, and Savings
Fact tables form the core of your analytical engine. Design them to store metrics such as usage hours, dollar charges, budget caps, and realized savings. Separate, detailed tables keep your dashboard fast as data grows.
Build Dimensions for Accounts, Subscriptions, Projects, Services, and Regions
Dimensions add context that makes data meaningful. Link fact tables to dimensions such as accounts, subscriptions, projects, services, and regions to support detailed analysis. Users can then filter costs by business units or technical environments with ease.
Normalize Provider-Specific Billing Categories
Cloud providers use different terms for services and billing line items. A strong cloud cost data model standardizes these differences in one schema. This approach keeps dashboard reports consistent across AWS, Azure, and Google Cloud.
Preserve Both Amortized and Unblended Cost Views
Keep both amortized and unblended cost views in your model. Unblended costs show actual cash outflow for a specific period, making them useful for immediate budget tracking. Amortized costs spread upfront payments over time, showing the true daily cost of resources.
| Data Component | Primary Purpose | Key Benefit |
|---|---|---|
| Fact Tables | Quantitative Metrics | High-speed aggregation |
| Dimensions | Contextual Metadata | Granular filtering |
| Amortized View | Long-term Planning | Accurate unit economics |
| Unblended View | Cash Flow Tracking | Real-time invoice reconciliation |
Connect Billing Sources and Validate the Data
A strong pipeline for your cloud billing exports creates clear cost data. Without a clean, steady flow, your dashboard cannot guide sound financial decisions.

Enable Billing Exports and Cost Management APIs
First, configure each cloud provider to send data to one central location. Amazon Web Services, Microsoft Azure, and Google Cloud offer native cloud billing exports. These exports send granular usage records directly to storage buckets.
Use Cost Management APIs to collect real-time data beyond static files. They let your reporting layer fetch current spending patterns before the final monthly invoice arrives.
Load Detailed Usage and Invoice Data Into the Reporting Layer
After access is available, automate file ingestion into your data warehouse. This ETL (Extract, Transform, Load) process must handle large data volumes. It must also protect data integrity across different providers.
Standardize the schema during this phase. Normalize provider-specific formats into one structure. Then your dashboard can compare costs across platforms clearly.
Reconcile Dashboard Totals With Provider Invoices
Before sharing the dashboard, perform a reconciliation check. Compare the sum of ingested usage records with the official cloud vendor invoice.
If the totals differ, investigate the discrepancy at once. Accuracy is the foundation of trust in any financial reporting system.
Resolve Delayed Charges, Credits, and Duplicate Records Before Publishing
Cloud billing exports often have quality issues. Account for delayed charges that appear days after usage occurs. Also include service credits that may reduce total spending.
Add rules to remove duplicate records from API retries. Fixing these issues ensures published figures show your infrastructure’s true financial state.
| Data Source | Ingestion Method | Latency | Primary Use Case |
|---|---|---|---|
| AWS Cost Explorer | API | Near Real-Time | Daily Anomaly Detection |
| Azure Consumption | Export to Blob | 24 Hours | Monthly Budget Tracking |
| GCP Billing | BigQuery Export | Hourly | Granular Cost Allocation |
Build the Core Cost Monitoring Views
You can turn raw billing data into useful insights with a structured cloud spend dashboard. This tool supports financial operations by turning complex invoices into clear visuals of infrastructure use.
Clear, accessible views help every stakeholder understand where money goes. Consistency is the key to building trust in your data across the entire organization.

Show Total Spend by Day, Month, Provider, and Account
Your cloud spend dashboard should offer a clear summary of financial health. Show total costs by day and month to spot sudden spikes or steady growth.
Segment this data by providers, such as AWS, Azure, or Google Cloud, to compare vendor performance. Break down totals by account to find which business units drive the highest costs.
Break Down Costs by Service, Region, Environment, and Team
After reviewing totals, give teams details that help them manage their budgets. A robust cloud spend dashboard lets users filter costs by services such as compute, storage, or networking.
Categorize spending by region, environment, and team to match operational needs. This detail helps engineers take ownership of their resources and find ways to improve efficiency.
Compare Current Spending With Previous Periods
Understanding your current burn rate is only half the battle. Compare today’s spending with earlier periods to spot meaningful changes in your financial path.
Comparing month-over-month or year-over-year data separates expected growth from unnecessary waste. This history supports accurate budgets and long-term plans.
Use Consistent Filters and Drill-Down Paths Across Every View
Keep your cloud spend dashboard easy to use with the same filters on every page. When users select a team or time range, keep that filter as they open other reports.
Standard drill-down paths give users the same method for investigating cost anomalies. This consistency cuts confusion, so your team can optimize instead of deciphering data.
Add Budget, Forecast, and Variance Tracking
Cloud spending can become a predictable business asset instead of a mystery. With cloud budget tracking, you can see where money goes before the month ends. This proactive approach helps protect healthy profit margins.

Set Budgets at the Organization, Account, Team, and Application Levels
Strong financial governance requires detailed control. Set budgets that match your organization, so each dollar has a clear owner. This prevents the “tragedy of the commons,” where no one feels responsible for shared infrastructure costs.
These limits help individual engineers make informed choices. Local accountability prevents runaway costs while supporting high-velocity development cycles.
Calculate Month-End Forecasts From Actual Usage and Run Rate
Reliable cloud cost forecasting helps you predict the final invoice. By combining actual month-to-date usage with the current daily run rate, you can project total billing-cycle costs. This method shows your likely financial path.
A new deployment can raise the run rate, so the forecast adjusts automatically. This early warning gives finance and engineering time to optimize resources before the bill affects your bottom line.
Highlight Budget Variance With Clear Thresholds
Static budgets rarely catch issues early. Set clear variance thresholds to alert you when spending differs from the expected plan. Allow room for normal business growth, but keep thresholds strict enough to catch errors.
Distinguish One-Time Spikes From Persistent Overspending
Not every cost increase needs immediate action. Distinguish a one-time spike, such as a large data migration or load test, from ongoing overspending. Persistent overspending signals a structural issue needing a long-term fix; a spike often ends on its own.
| Budget Metric | Purpose | Action Required |
|---|---|---|
| Organization Level | High-level financial health | Quarterly review |
| Team/App Level | Operational accountability | Weekly monitoring |
| Variance Threshold | Anomaly detection | Immediate investigation |
| Run Rate Forecast | Predictive planning | Monthly adjustment |
Correctly categorizing these events prevents “alert fatigue” and focuses your team on the most valuable optimization opportunities. Consistent monitoring keeps your cloud environment efficient and scalable.
Monitor Usage Drivers and Cost Efficiency
Mastering cloud unit economics helps you scale infrastructure without letting your budget spiral out of control. Monthly spend gives a high-level view, but it can hide inefficiencies that drain resources over time.
Track Unit Economics Such as Cost Per Customer, Request, or Transaction
To understand spending, map cloud costs to business output. Calculate the cost per customer, cost per request, or cost per transaction. This shows whether your infrastructure becomes more or less efficient as you grow.
This approach lets engineering teams see how code changes affect finances in real time. Linking technical performance to business value creates shared language for finance and development teams.
Compare Resource Utilization With Allocated Capacity
Compare actual resource use with the capacity you have provisioned. Many organizations pay for idle or oversized instances that sit unused, causing major waste.
Monitoring these gaps helps you identify overprovisioning and match architecture to real demand. This analysis helps reclaim budget lost to underused cloud assets.
Measure Cost Trends Against Business and Engineering Metrics
Compare cloud spending with business growth metrics to assess operational health. Track infrastructure costs beside user growth, data volume, and feature releases.
If costs rise faster than business metrics, your cloud unit economics need optimization. This view keeps engineering focused on scalable, cost-effective solutions.
Use Ratios to Detect Efficiency Changes That Total Spend Can Hide
Total spend may stay flat while efficiency quietly declines. Ratios, such as compute cost per active user, reveal hidden trends before they cause major financial problems.
These ratios give your team an early warning. Watching them helps keep your cloud environment lean and high-performing as your business grows.
Detect Anomalies and Unexpected Spending
Effective cloud cost anomaly detection gives your infrastructure budget an early warning. It catches irregular costs before they cause major financial waste. This process combines past usage patterns with business rules to track spending habits.
Define Statistical and Rule-Based Anomaly Thresholds
Modern monitoring uses two methods to identify problems. Statistical baselines study past usage and define what is normal for your environment. The system sends an alert when spending differs from those patterns.
Rule-based thresholds add safety for critical accounts. Set firm limits for services or regions, so small increases do not go unnoticed. This approach keeps your cloud cost anomaly detection strategy flexible and strict.
Flag Sudden Changes in Compute, Storage, Network, and Database Costs
Sudden spikes can signal misconfigurations or runaway processes. Your dashboard should flag unusual activity across these main infrastructure areas:
- Compute: Unexpected scaling events or abandoned high-performance instances.
- Storage: Rapid growth in unmanaged snapshots or orphaned volumes.
- Network: Unusual data transfer spikes between regions or to the public internet.
- Database: Unplanned read/write throughput increases or storage expansion.
Connect Anomalies to Owners and Affected Resources
An alert matters only when it leads to quick action. Your system must link each anomaly to the responsible team or individual owner. Effective resource tags show which application or environment caused the cost surge.
Reduce Alert Fatigue With Severity Levels and Notification Rules
Too many notifications can cause team burnout and ignored warnings. Use severity levels to rank alerts by financial impact. Low-level changes may trigger a weekly report, while critical budget breaches need immediate Slack or email alerts.
Refined cloud cost anomaly detection rules help engineers focus on urgent incidents. This approach protects productivity while controlling cloud expenses.
Identify Cloud Waste and Optimization Opportunities
Growing cloud systems often collect resources that waste money without adding value. A steady cloud waste reduction plan helps teams recover that money and invest it in new ideas. Regular monitoring turns hidden costs into clear chances for financial growth.
Find Idle, Orphaned, Oversized, and Underused Resources
Start by scanning for assets that no longer serve a purpose. Idle resources, such as unattached load balancers or stopped instances, can keep charging your account. Likewise, orphaned volumes left after server deletion can quickly raise your monthly invoice.
Look for oversized instances that offer more capacity than your applications need. Finding these underused assets helps you match infrastructure to real demand. This process keeps your cloud footprint lean and efficient.
Review Storage Lifecycle, Snapshot Retention, and Data Transfer Costs
Waste often hides in storage layers that engineering teams overlook. Use storage lifecycle policies to move old data to cheaper tiers, such as Amazon S3 Glacier or Azure Archive Storage. This change keeps stale data out of expensive, high-performance storage.
Also, review your snapshot retention policies to avoid paying for years of redundant backups. Data transfer costs also offer major savings opportunities. Optimize service communication across regions or zones to reduce unnecessary egress fees.
Prioritize Opportunities by Savings, Risk, and Implementation Effort
Optimization tasks differ, so rank them by their likely impact. A clear plan helps your team handle high-value tasks first. Use the following framework to organize findings and guide your cloud waste reduction efforts.
| Opportunity Type | Potential Savings | Risk Level | Effort Required |
|---|---|---|---|
| Delete Orphaned Volumes | High | Low | Low |
| Right-size Instances | Medium | Medium | Medium |
| Lifecycle Policy Setup | High | Low | Medium |
| Refactor Architecture | Very High | High | High |
Separate Quick Wins From Changes Requiring Application Refactoring
Separate simple tasks from complex projects to maintain progress. Quick wins, such as deleting unused snapshots or resizing instances, quickly lower costs with little disruption. Focus on these tasks during the first stages of your optimization work.
By contrast, application refactoring requires deeper code changes or architectural shifts. These projects offer the largest long-term savings but bring greater risks and need careful planning. Balance them with smaller improvements to keep your cloud waste reduction program moving forward.
Track Savings Plans, Reserved Capacity, and Discounts
Effective cloud financial management depends on tracking discounted capacity well. Strong savings plans monitoring turns complex billing data into useful insights. Close tracking helps your organization gain the most value from every dollar spent.
Measure Coverage and Utilization for Amazon Web Services Savings Plans
AWS Savings Plans offer flexibility, but they need active management to work well. Focus on two key metrics: coverage and utilization. Coverage shows the percentage of eligible spending covered by a plan, while utilization shows how much commitment you use.
High utilization signals efficiency, but low coverage may show missed savings. Reviewing both metrics often helps match commitments to your actual infrastructure needs.
Evaluate Microsoft Azure Reservations and Google Cloud Committed Use Discounts
AWS uses Savings Plans, while Microsoft Azure and Google Cloud use Reservations and Committed Use Discounts (CUDs). These programs offer deep discounts for a 1-year or 3-year term. Use consistent financial measures when comparing programs across providers.
Normalized data shows which provider gives the best return for your workload patterns. This savings plans monitoring approach prevents over-commitment in one cloud while money remains unused in another.
Compare Discount Benefits With On-Demand Alternatives
Compare commitment costs with the flexibility of on-demand pricing. On-demand rates cost more, but they let you scale down instantly when business needs change. Strategic planning balances discount stability with the agility of on-demand resources.
Monitor Expiration Dates, Underutilization, and Commitment Risk
Ignoring commitment lifecycles can waste budget and create operating limits. Track expiration dates to prevent sudden cost increases when a discount term ends. Find underused resources so you can reallocate capacity before it becomes a financial burden.
| Provider | Discount Type | Primary Benefit | Risk Factor |
|---|---|---|---|
| AWS | Savings Plans | High Flexibility | Underutilization |
| Azure | Reservations | Predictable Costs | Commitment Lock-in |
| Google Cloud | CUDs | Deep Discounts | Expiration Gaps |
A clear view of commitment risk protects your organization from avoidable costs. Consistent savings plans monitoring helps maintain a lean, efficient cloud environment over time.
Design Dashboard Alerts and Optimization Workflows
A strong monitoring system needs more than visual charts. It also needs active support from your engineering teams. Effective cloud cost alerts turn passive data into useful action and stop budget overruns before they grow.
Route Budget, Anomaly, and Optimization Alerts to the Right Owners
Good communication sends the right information to the right people at the right time. Map each cloud resource to an owner or team to reduce notification fatigue. When an alert triggers, send it to someone who can make changes, such as a lead developer or system administrator.
Define Review, Approval, and Remediation Processes
Before you enable automated triggers, set a clear governance framework for handling incoming notifications. A clear process ensures each alert gets a quick review to confirm its validity. This prevents panic and keeps remediation steps aligned with your company’s operating standards.
Record Actions, Expected Savings, and Realized Savings
Track each optimization task to show the value of your cloud management efforts. Document the initial problem, proposed solution, and final financial impact. This history helps refine future strategies and shows your team’s contribution to the bottom line.
Use ServiceNow, Jira, Slack, or Microsoft Teams to Track Follow-Through
Connect monitoring tools with platforms like Jira or Slack to keep your team focused and accountable. Automated tickets or messages help ensure that no optimization opportunity is forgotten. This workflow creates a clear audit trail and makes progress easy to measure over time.
| Workflow Stage | Primary Tool | Key Objective |
|---|---|---|
| Alert Notification | Slack / Teams | Immediate Awareness |
| Task Management | Jira / ServiceNow | Accountability Tracking |
| Financial Reporting | Dashboard / BI | Verify Realized Savings |
Apply Security, Governance, and Access Controls
Effective cloud governance protects financial insights from unauthorized access. A dashboard that combines billing data creates a central target for internal teams and security threats. Strong security controls help protect accurate financial reports.
Restrict Sensitive Billing and Usage Data by Role
Not every user needs to see the details of your cloud invoices. Use Role-Based Access Control (RBAC) so team members see only data tied to their duties. For example, an engineer may need resource usage metrics, while a finance manager needs high-level budget summaries.
Separate Read-Only Reporting From Remediation Permissions
It is best practice to separate your reporting layer from your operational control layer. Viewing cost data should not give users permission to modify or delete cloud resources. This boundary prevents accidental or unauthorized changes that could disrupt your production environment.
Protect Credentials, Exports, APIs, and Data Warehouse Connections
Your dashboard uses sensitive connections to billing APIs and data warehouses. Secure these pathways with encrypted service accounts and rotating credentials. Never hardcode API keys in dashboard configuration files, because this exposes your infrastructure to unnecessary risk.
Maintain an Audit Trail for Dashboard Changes and Cost Actions
Accountability is a core part of cloud governance. Log every change to dashboard settings and every automated cost-saving action. An audit trail shows your security team who acted and when, ensuring full transparency across your organization.
| User Role | Access Level | Primary Action |
|---|---|---|
| Finance Analyst | Read-Only | Budget Review |
| Cloud Engineer | Limited Write | Resource Optimization |
| Security Admin | Full Access | Audit and Governance |
Test, Launch, and Improve the Dashboard
A successful cloud cost dashboard best practices strategy needs careful testing and stakeholder feedback. Before giving access to everyone, confirm the data is accurate and easy to understand. A smooth move from development to production builds lasting trust with your teams.
Validate Totals, Filters, Allocations, and Forecast Calculations
First, verify that dashboard totals match official provider invoices. Check whether filters isolate environments, such as production and staging, to prevent misleading data. Precision is vital when you calculate forecasts because poor projections can cause budget panic or missed savings.
Run a Pilot With Finance and Engineering Stakeholders
Invite a small group of power users from finance and engineering to test the interface. This pilot can reveal unclear definitions, missing ownership, or unusable drill-downs that may confuse end users. Use their feedback to improve the layout so it supports decisions, not just raw numbers.
Document Definitions, Data Freshness, and Known Limitations
Transparency is central to cloud cost dashboard best practices. Write clear documentation explaining how you define “waste” and “savings” to prevent confusion. State whether data updates hourly or daily, and list known limits for specific service tags.
Schedule Regular Reviews of Metrics, Alerts, and User Feedback
Your work does not end at launch. Set regular reviews for key performance indicators, and adjust alert thresholds as business needs change. Regular user feedback keeps the tool useful and drives meaningful cost efficiency across the company.
| Validation Step | Primary Goal | Stakeholder |
|---|---|---|
| Invoice Reconciliation | Ensure financial accuracy | Finance Team |
| Tagging Audit | Verify cost ownership | Engineering Leads |
| Forecast Testing | Validate trend logic | Operations |
| User Feedback Loop | Improve usability | All Users |
Common Cloud Cost Dashboard Mistakes to Avoid
Building a strong reporting tool is a major achievement, but common traps can still make it fail. Many organizations face cloud cost dashboard mistakes that make their data useless for daily operations. Find these problems early to keep your dashboard useful and reliable.
Relying on Total Spend Without Showing Cost Ownership
A common error is showing one huge number for total monthly spending. This matters to finance, but it gives engineering teams no useful context. Without clear cost ownership, no one feels responsible for bill changes.
Publishing Inconsistent Definitions for Usage and Savings
Confusion starts when departments use different math to measure efficiency. If finance defines “savings” differently from DevOps, trust in the dashboard will fade fast. You must standardize your metrics across the organization to keep one trusted source of truth.
Creating Too Many Metrics Without Clear Actions
Adding every available data point may cause “analysis paralysis.” A dashboard should support action, not simply display attractive charts. If a metric does not guide a decision or optimization task, it is likely noise.
Ignoring Shared Services, Data Transfer, and Unallocated Costs
Many teams focus only on compute costs and miss these “hidden” expenses. Leaving them out creates an incomplete view of your total cloud footprint. Consider these categories to avoid common cloud cost dashboard mistakes:
- Shared Services: Properly allocate costs for logging, security, and monitoring tools.
- Data Transfer: Track egress fees, which often spike unexpectedly in complex architectures.
- Unallocated Costs: Create a “catch-all” category to ensure every dollar is accounted for in your reports.
By focusing on clarity and accountability, you can turn your dashboard into a strategic engine for your business. Avoid these errors to keep cloud spending transparent and under control.
Conclusion
Managing infrastructure expenses takes more than a set of charts. A strong cloud cost optimization strategy combines accurate billing data, clear ownership, and repeatable workflows. Together, these elements turn raw numbers into useful insights that support business value.
Your dashboard acts as the central nervous system for financial health. It should combine billing data from Amazon Web Services, Microsoft Azure, and Google Cloud with budgets and forecasts. This complete view helps teams spot anomalies, find waste, and track savings plans precisely.
Success requires regular validation and review. As cloud use changes, your metrics must reflect new architectures and business goals. Regular data audits keep your cloud cost optimization strategy useful for finance, engineering, and operations stakeholders.
Start by building accountability, with a clear owner for every resource. Use your dashboard to start conversations about efficiency, not only total spending. Regular tool use helps your organization stay in control while scaling effectively in the cloud.