






In today’s fast-paced market, companies across the United States must turn raw operational data into timely decisions. Mastering real-time business intelligence dashboard development helps companies stay ahead of competitors. By transforming complex numbers into clear, actionable insights, you empower your team to act with confidence.
A well-crafted business intelligence dashboard focuses on key metrics and intuitive visuals. Our guide covers the full journey, from solid data foundations to strong security and testing. It also explores user adoption and ongoing maintenance, helping systems run smoothly.
Whether refining your current setup or starting from scratch, these tips help you build tools that drive growth. Let’s explore the essential steps for creating high-impact visual analytics.
Table of Contents
Key Takeaways
- Prioritize clear visuals to simplify complex data sets for your team.
- Focus on key performance metrics that directly influence your bottom line.
- Ensure data security is integrated into every stage of the build.
- Promote user adoption through intuitive design and consistent training.
- Plan for ongoing maintenance to keep your insights accurate and relevant.
Define the Decisions the Dashboard Must Support
Designing a successful real-time BI dashboard starts with needed decisions, not desired charts. Teams often choose visual style or software features instead of useful business results. Start with the goal so every pixel has a clear purpose.

Identify the People Who Will Use the Dashboard
Different stakeholders need different levels of detail to do their jobs well. Executives may need revenue trends, while frontline managers need detailed data about urgent operating problems.
Map user personas early. Consider these distinct groups:
- Executives: Need strategic insights and high-level performance indicators.
- Managers: Require tactical data to monitor team productivity and resource allocation.
- Frontline Teams: Need immediate, actionable alerts to handle customer issues or system failures.
Connect Each View to a Specific Business Decision
Each chart or table on your real-time BI dashboard should answer a specific question. If a visual cannot guide a process change or strategy adjustment, it is likely noise.
“Data is only as valuable as the decisions it enables. If you cannot articulate the action a user should take after viewing a metric, that metric does not belong on your screen.”
Ask users what keeps them up at night. When design matches daily challenges, a passive reporting tool becomes an active decision-making engine.
Set Expectations for Freshness, Accuracy, and Actionability
Not every business process needs updates in less than one second. Balance the technical cost of real-time data with each user’s actual needs.
Define what “real-time” means for each use case. For some processes, a five-minute delay works, while others need true streaming data to prevent financial loss. Set these expectations early to prevent frustration and keep your real-time BI dashboard a trusted source of truth.
Real-Time Business Intelligence Dashboard Development: Start With the Right Metrics
Success in real-time business intelligence dashboard development starts with the right metrics. Too much noise makes it hard for users to find important signals. A well-designed KPI dashboard guides your team toward clear business goals.

Separate Key Performance Indicators From Supporting Measures
Not every data point belongs on your primary screen. You must separate high-level Key Performance Indicators (KPIs) from supporting measures that add context. KPIs should represent the ultimate health of your business, while supporting metrics explain the “why” behind those numbers.
This separation prevents cognitive overload. Users can scan top-level indicators, then explore details. This hierarchical approach keeps the most critical information in focus.
Choose Metrics That Reflect Current Business Priorities
Your dashboard metrics must match the company’s current priorities. If customer retention matters most, highlight churn rates and satisfaction scores instead of raw sales volume. Metrics that do not drive action are vanity numbers that clutter your view.
Review your metrics regularly to ensure they still match your strategic objectives. As business goals shift, your dashboard must change with them. Staying relevant is the key to maintaining user trust and engagement over time.
Document Metric Definitions, Owners, and Calculation Rules
Transparency builds data literacy. Every dashboard metric needs a clear definition, an assigned owner, and a documented calculation rule. When people know how a number is calculated, they are more likely to trust the data.
Prevent Conflicting Definitions Across Departments
Few things damage credibility faster than two departments reporting different numbers for one metric. You must establish a single source of truth to prevent conflicting definitions. Standard rules ensure every team speaks the same language.
Make Targets and Benchmarks Easy to Interpret
A number without context often means little. Include targets and benchmarks so users can see whether performance is on track. Visual cues like color-coding or trend arrows help users interpret these benchmarks at a glance and make faster, informed decisions.
Build a Reliable Real-Time Data Foundation
A successful dashboard development project starts before you choose your first chart. Build a strong technical architecture so your insights stay accurate and timely. Without this foundation, beautiful visuals may not provide value to your team.

Map Operational Data Sources Before Designing Visuals
Before building, map every operational data source. Learn where information begins and how it moves through your systems. This process reveals bottlenecks that could harm your data quality early.
Choose Between Streaming, Microbatch, and Scheduled Updates
Choosing the right update frequency is vital for your real-time data strategy. Match the delivery method to your business decisions:
- Streaming: Best for immediate, event-driven responses where every second counts.
- Microbatch: Ideal for balancing system load while maintaining near-instant visibility.
- Scheduled Updates: Sufficient for high-level summaries that do not require sub-minute precision.
Use a Trusted Semantic Layer for Consistent Reporting
Implementing a semantic layer creates one source of truth for your organization. It turns complex database schemas into business-friendly terms everyone understands. This consistency stops conflicting metrics from appearing in team reports.
Account for Late, Missing, and Duplicate Events
Real-world data is rarely perfect, so your architecture must handle common problems. Build logic for late events and missing records to protect high data quality. Remove duplicate entries so your final numbers remain trustworthy.
Track Data Lineage From Source to Dashboard
Understanding your data’s path is central to professional dashboard development. Tracking data lineage helps you troubleshoot problems when a number looks wrong. This transparency builds trust with users who rely on your semantic layer for critical business choices.
Set Data Freshness and Latency Requirements
For real-time data, speed is only half the battle. The information must also fit the decisions your team makes throughout the day.
Define Acceptable End-to-End Latency for Each Use Case
Not every metric needs sub-second updates to remain useful. Group dashboard components by how fast information changes and how urgent the resulting actions are.
A high-frequency trading monitor needs near-zero data latency, while a daily sales summary may work well with hourly updates. Matching delivery speed to business needs prevents unnecessary infrastructure costs.

Distinguish Data Arrival Time From Dashboard Refresh Time
Users often confuse when data reaches the database with when it appears on their screen. Explain that data freshness depends on ingestion and browser refresh cycles.
If your pipeline takes five minutes to process a batch, a dashboard refreshing every ten seconds still shows five-minute-old information. Explaining this difference helps manage user expectations.
Display Last-Updated Timestamps and Freshness Warnings
Always show a clear timestamp so users know how current the numbers are. If a delay occurs, a subtle warning icon can alert users without causing panic.
This transparency builds long-term trust with your audience. When users understand data limits, they are less likely to make hasty decisions based on stale information.
Establish Service-Level Objectives for Critical Metrics
Set clear goals for data latency so your team can track performance. These objectives give engineers a benchmark for maintaining healthy data pipelines.
When setting targets, focus on metrics with the greatest business impact. This keeps your most important real-time data reliable and accurate under pressure.
Explain Delays Without Overwhelming Dashboard Users
Technical glitches happen, but they need not ruin the user experience. Use simple, human-readable messages when an outage temporarily affects data freshness.
Avoid jargon that may confuse non-technical stakeholders. Provide a clear status update and estimated resolution time to keep everyone informed and calm.
Design a Dashboard Layout That Supports Fast Decisions
Strong dashboard design helps stakeholders make critical decisions in seconds, not minutes. A clean, intuitive layout guides users to needed information. It avoids extra searching and scrolling.

Place the Most Important Signals Above the Fold
Place the most critical metrics at the top of the screen. Users should understand operational health as soon as the page loads. Prioritizing high-level KPIs in this above-the-fold area removes initial navigation.
Organize Content From Summary to Root Cause
Effective layouts follow a logical flow that matches the user’s thought process. Start with a high-level summary of performance. As users move down, show more detailed data to help them investigate the root cause of anomalies.
Use Consistent Spacing, Alignment, and Visual Hierarchy
Consistency supports professional dashboard design. Use a standard grid to align elements, reduce mental effort, and create an organized interface. Even spacing helps the eye follow the intended information path.
“Simplicity is the ultimate sophistication.”
Keep Filters Visible Without Crowding the Main View
Filters support interactivity, but they should not clutter the main workspace. Place them in a dedicated sidebar or clean top bar that stays accessible. This keeps the main view focused while users refine their search.
Use Progressive Detail for Complex Operational Questions
Not every user needs every data point at once. Use progressive disclosure to hide complex details until requested. This keeps the interface clean while supporting deep analysis when needed.
| Layout Element | Primary Purpose | User Benefit |
|---|---|---|
| Top KPIs | Immediate Status | Faster awareness |
| Sidebar Filters | Context Control | Reduced clutter |
| Drill-down Links | Root Cause Analysis | Deep investigation |
| Grid Alignment | Visual Order | Improved readability |
Choose Visuals That Make Real-Time Patterns Clear
Effective data visualization turns complex data into clear choices. The right chart helps your team understand key patterns in seconds. Matching the visual to each user’s question marks a professional KPI dashboard.

Use Line Charts to Show Movement Over Time
Line charts remain the gold standard for tracking trends and finding performance shifts. They help users track change in sales volume, website traffic, or server load. Plotting points across time reveals the rhythm of business operations.
Use Bar Charts to Compare Categories and Segments
Bar charts offer the most intuitive way to compare different groups. They show the relative size of categories, including regional performance or product sales. Users can quickly spot top performers and groups needing attention.
Reserve Gauges and KPI Cards for Focused Status Checks
Gauges and KPI cards provide a quick “health check” for critical metrics. Use them for high-level indicators that need an immediate yes-or-no answer. Place them prominently so users do not miss vital information.
Highlight Thresholds, Targets, and Meaningful Variance
A KPI dashboard is useful when it shows current performance against expectations. Use clear visual indicators for targets and thresholds, such as color-coded alerts or variance markers. These cues help users separate normal fluctuations from real performance issues.
Avoid Decorative Charts That Slow Interpretation
Avoid 3D effects, complex gradients, and unnecessary animations. They clutter the screen and distract users from the core message. Choose clean, minimalist designs that value speed of interpretation over aesthetic flair.
| Chart Type | Primary Purpose | Best Use Case |
|---|---|---|
| Line Chart | Trend Analysis | Tracking performance over time |
| Bar Chart | Comparison | Comparing categories or segments |
| KPI Card | Status Check | Monitoring critical thresholds |
| Gauge | Goal Tracking | Visualizing progress toward a target |
Make Trends, Exceptions, and Context Easy to See
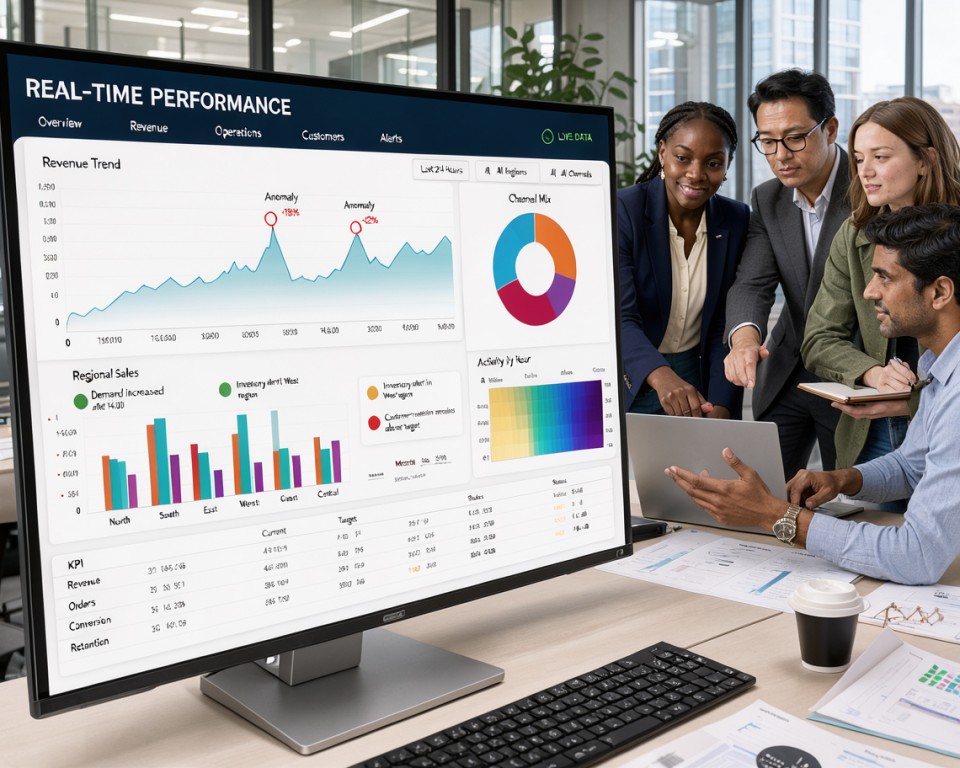
Effective dashboards turn isolated data points into a clear story for your team. Raw numbers alone can hide the bigger picture. High-quality data visualization provides the background needed to judge a metric.
Show Comparisons Against Targets and Previous Periods
A single number, such as “500 sales,” means little without a benchmark. To provide true insight, show current performance beside a target or past period. This helps users see upward trends or missed expectations at once.
Use Color to Signal Meaning Rather Than Decoration
Color should serve a purpose, not simply add style. Use bold colors to highlight critical exceptions or gaps needing immediate attention. Saving color for clear signals keeps users focused in your data visualization efforts.
Annotate Events That Explain Sudden Changes
Sudden data spikes or drops can cause panic when their cause is unknown. Simple chart notes can explain changes, such as a marketing campaign launch or system outage. This contextual clarity keeps users from investigating normal operational changes.
Design Accessible Color Scales for All Users
Inclusive design is central to professional data visualization. Make color palettes readable for users with color vision deficiencies by adding high-contrast patterns or distinct shapes. When everyone can read the data, your team makes more consistent decisions.
Prevent Misleading Charts With Appropriate Axes
Axis scales can greatly change how users see a trend. Always start bar charts at zero to avoid exaggerating small category differences. By maintaining honest and accurate scales, you build trust and keep the visual representation true to the data.
Build Useful Filters, Drilldowns, and Interactions
Smart interactions turn a basic display into a useful tool for business research. Guide users toward meaningful answers instead of giving them endless options. Purposeful clicks improve overall dashboard performance.
Prioritize Filters That Reflect Real Business Questions
Filters connect user curiosity with needed data. Do not add every variable. Choose filters that match the most common questions your team asks each day. Limiting choices to high-impact categories keeps the interface clean and focused.
Use Drilldowns to Move From Symptoms to Causes
A strong dashboard lets users start with a summary and dig deeper after spotting an anomaly. Use drilldowns to move from a broad symptom, such as a drop in sales, to its root cause. A drop in sales may point to a regional supply chain delay. This logical flow helps stakeholders decide faster without switching between reports.
Preserve Context When Users Change Time Ranges
Consistency matters when users explore data across different periods. If a user filters for a specific product line, that selection should stay active across daily, weekly, or monthly views. This context prevents frustration and keeps the story behind the data intact during the investigation.
Show Active Filter States Clearly
Users should not guess which filters apply to their view. Use clear visual signs, such as highlighted buttons or summary tags, to show active states. This transparency builds trust and prevents decisions based on incomplete or filtered data sets.
Prevent Slow Queries From Breaking the User Experience
Complex interactions can cause lag, hurting user experience. To maintain high dashboard performance, optimize backend queries so deep drilldowns load quickly. If an interaction needs heavy processing, use loading indicators or cached results to keep the interface responsive and reliable.
Design Alerts That Lead to Timely Action
Turning raw data into useful action starts with smart, context-aware notifications. When configured correctly, dashboard alerts act as a digital pulse for your business and show when immediate attention is needed. They replace low-value pings with a system that highlights what truly matters.
Set Alert Thresholds Based on Business Impact
Not every data fluctuation requires an emergency meeting. Set thresholds by the real business impact of a metric, not by simple percentage changes. Focus on outcomes that affect revenue or customer satisfaction, so your team reacts only to significant events.
Reduce Alert Fatigue With Priorities and Cooldowns
Too many notifications can cause burnout and make users ignore important warnings. A priority system sorts alerts by urgency, while cooldown periods stop duplicate messages about the same ongoing issue. This balance keeps your team focused on high-priority tasks without overwhelming noise.
Include the Right Context in Every Notification
A useful alert gives recipients enough information to understand the situation at once. Every notification should name the affected metric, specific time period, business area, and expected response. Naming the next responsible person makes accountability clear when the alert arrives.
Route Alerts to Email, Microsoft Teams, or Slack
The delivery method should match the message’s urgency. Critical dashboard alerts might go through Slack or Microsoft Teams for instant visibility; summary reports or lower-priority updates suit email. The right channel sends information to the right person within their preferred workflow.
Define Escalation Paths for Unresolved Issues
Even the best systems for dashboard alerts encounter issues that are not resolved quickly. Clear escalation paths ensure an unresolved issue moves automatically to the next management level after a set time. This structure prevents bottlenecks and keeps operations running smoothly.
| Alert Priority | Business Impact | Primary Channel | Escalation Time |
|---|---|---|---|
| Critical | Revenue Loss | Slack/Teams | 15 Minutes |
| Warning | Process Delay | 2 Hours | |
| Informational | Trend Shift | Dashboard | 24 Hours |
Optimize Dashboard Performance at Scale
As your organization grows, keeping a dashboard fast and responsive becomes a major technical challenge. Effective dashboard development requires a proactive plan for rising data volumes without losing speed. Slow systems can weaken trust in insights and delay decisions.
Reduce Query Complexity and Unnecessary Data Transfers
Complex queries often cause high data latency. Pull only the fields your visualizations need instead of entire datasets. Streamlined SQL or API calls reduce pressure on backend systems.
“Efficiency is doing things right; effectiveness is doing the right things.”
Use Aggregations, Caching, and Incremental Processing Strategically
Pre-calculating data with aggregations lets your dashboard show results at once. A strong caching layer stops repeat requests from hitting databases again. Furthermore, incremental processing updates only new data points, keeping your dashboard performance steady as historical records grow.
Set Performance Budgets for Loading and Interaction
Clear performance budgets guide your development team. Set targets for page loads and filter response times to support a smooth user experience. Meeting these budgets lowers data latency and keeps stakeholders engaged with the platform.
Test Concurrent Usage During High-Demand Periods
Testing heavy traffic shows how infrastructure handles many users at once. During peak hours, competing resource demands can create unexpected bottlenecks. Rigorous testing keeps the system stable when every department needs access simultaneously.
Monitor Query Failures, Timeouts, and Resource Consumption
Continuous monitoring helps teams fix issues before users notice them. Tracking query timeouts and resource use reveals inefficient reports that may need optimization. Addressing these hurdles helps maintain a reliable, high-performing tool for the entire team.
Protect Sensitive Business Data Without Limiting Usability
Strong dashboard security does not require locking away useful team insights. Create a safe environment where users access only the information needed for their jobs. Smart security layers protect sensitive data while helping your team stay productive.
Apply Role-Based Access to Dashboards and Data
Role-based access control (RBAC) supports a secure dashboard strategy. Assign permissions by job function, so executives see summaries while analysts review detailed data. This prevents unauthorized users from viewing sensitive reports outside their responsibilities.
Protect Personally Identifiable and Financial Information
Protecting customer names and financial records should be a top priority for every organization. Mask or redact personally identifiable information (PII) at the database level before it reaches the dashboard. This lets your team study trends without exposing confidential details that may create compliance risks.
Use Row-Level Security for Regional and Team Views
Implementing row-level security controls data visibility for large, diverse teams. It filters data automatically according to a user’s profile, region, or department. With row-level security, a manager in the North American office sees only territory data, keeping dashboards clean and secure.
Log Access, Exports, and Administrative Changes
Maintaining a detailed audit trail supports accountability. Log every dashboard access, data export, and administrative configuration change. These logs help identify potential security threats and keep data practices fully transparent.
Define Data Retention and Export Policies
Clear rules for data storage and exports support long-term safety. Allow only authorized personnel to download raw data. Strict retention rules reduce risks from stale or sensitive information in unauthorized locations, keeping your row-level security measures effective.
Validate Accuracy With Testing and Reconciliation
Before using real-time metrics for critical business decisions, verify their integrity. A strong validation process keeps your dashboard a reliable source of truth for your organization. High data quality helps prevent costly mistakes caused by incorrect information.
Compare Dashboard Results With Trusted Source Systems
Start by reconciling dashboard results with your primary source systems. Check that raw numbers match exactly at the database level. If you find differences, investigate the transformation logic at once to ensure complete alignment.
Test Calculations, Filters, Time Zones, and Edge Cases
Complex dashboards use advanced math that may fail under certain conditions. Test every filter and time zone conversion across regions to keep data consistent. Also simulate edge cases, such as leap years or periods with zero activity, to test unusual inputs.
Verify Real-Time Behavior During Data Delays and Outages
Real-world environments are rarely perfect, so test how your dashboard handles interruptions. Watch how the interface displays information during pipeline delays or a total outage. Clear data freshness updates help users know when to pause decisions.
Use Automated Data Quality Checks
Manual testing cannot support dynamic environments alone. Use automated scripts that run continuously and flag anomalies or missing values. These tools warn your team early, so it can fix issues before they affect the end-user experience.
Obtain User Acceptance From Operational Teams
Finally, involve the people who use the dashboard every day. Operational teams can best judge whether metrics reflect their workflow reality. Their formal sign-off confirms that the dashboard can support high-stakes business operations.
Make the Dashboard Accessible Across Devices and Teams
A truly effective business intelligence dashboard must be accessible to everyone on any device. When teams access critical insights anywhere, they make better decisions faster. A seamless experience requires planning for different screen sizes and user needs.
Design Responsive Views for Desktops, Tablets, and Phones
A responsive dashboard automatically adjusts its layout to fit each user’s screen. On a desktop, you might show complex tables and several charts side by side. Mobile users need a simple vertical flow that highlights the most important data points.
Flexible grid systems keep visuals sharp and readable on every device. This approach prevents horizontal scrolling, which frustrates users and hides vital information.
Support Keyboard Navigation, Readable Text, and Screen Readers
Inclusive dashboard design is essential for a diverse workforce. Ensure users who cannot use a mouse can reach every interactive element with keyboard shortcuts. High-contrast color schemes and scalable fonts make data easier for everyone to read.
Adding descriptive labels to charts helps screen readers interpret data for visually impaired team members. Prioritizing accessibility creates a fairer workplace where every employee can engage with the company’s performance metrics.
Adapt Views for Executives, Analysts, and Frontline Users
Different roles require different detail levels to do their jobs well. Executives often prefer high-level summaries that show trends, while analysts need deep-dive tools to investigate specific anomalies. Frontline workers benefit from real-time status updates that guide their immediate daily tasks.
Keep Mobile Views Focused on Immediate Actions
When designing for mobile, remove clutter and focus on immediate actions. A mobile responsive dashboard should show only the most critical KPIs that need a quick response. This keeps the experience clean and prevents information overload during busy shifts.
Provide Clear Definitions Without Requiring a Training Manual
Great dashboard design should feel intuitive, so users understand it without a lengthy manual. Use clear, plain-language titles for every metric and tooltips explaining how each number is calculated. A self-explanatory interface helps your team spend less time learning the tool and more time acting on its insights.
Launch With Governance, Training, and Adoption in Mind
Launching a new dashboard starts your data journey. For long-term success, treat reporting tools as living products, not static files. A clear approach to dashboard governance builds trust in data and helps teams reach meaningful business goals.
Assign Owners for Metrics, Data Sources, and Dashboard Updates
Accountability supports every reliable reporting system. Without clear ownership, dashboard metrics can become outdated or misunderstood as business processes change. Assign people or teams to maintain each data stream.
| Role | Primary Responsibility | Key Focus |
|---|---|---|
| Data Steward | Source Integrity | Accuracy and Latency |
| Metric Owner | Business Logic | Definition Consistency |
| Dashboard Lead | User Experience | Layout and Performance |
Document Usage Rules and Interpretation Guidance
Even a simple interface can confuse users without context. Clear documentation shows each stakeholder how to read charts and apply business rules to data. Keep this documentation easy to find inside the dashboard.
“Data is a precious thing and will last longer than the systems themselves. Governance ensures that the value of your information remains intact as your organization grows.”
Train Users to Investigate Signals Rather Than Watch Numbers
True dashboard adoption grows when users investigate signals instead of watching numbers. Training should explain the “why” behind the data. Ask your team to question anomalies instead of accepting the status quo.
Collect Feedback Through Usage Data and Regular Reviews
You cannot improve what you do not measure. Track the views users access most to learn what matters to them. Hold regular reviews to discuss findings and meet current business needs.
Retire Views That No Longer Support Decisions
Clutter harms clarity. Remove a view or report when it no longer supports a clear business decision. Retiring outdated views keeps the interface clean and directs users to metrics that affect the bottom line.
Maintain and Improve Real-Time Dashboards After Launch
Launching your real-time BI dashboard begins your journey toward data-driven success. The initial rollout is a major milestone, but lasting value comes from regular dashboard maintenance. Treating your system as a living product keeps it a trusted source of truth.
Monitor Adoption, Accuracy, Latency, and Availability
To keep your tools effective, track how users interact with the interface. High dashboard adoption rates show that your team finds the data useful. If engagement drops, check whether the information remains relevant or the experience feels too complex.
Technical health also helps maintain user trust. Audit your data pipelines often to keep latency within acceptable limits and information accurate. Frequent downtime may push stakeholders back to manual spreadsheets.
Review Metrics When Business Processes Change
Business environments change often, so your reporting must change too. When your company updates its workflows, review the metrics shown on your screens. Outdated KPIs can cause poor decisions and confusion across departments.
Effective dashboard governance requires regular reviews to remove obsolete charts. Removing clutter helps users focus on signals that create the most value. Confirm that your calculation logic still supports current business goals.
Prioritize Enhancements by Decision Impact
You may receive many feature requests after launch. Prioritize updates by their potential to improve specific business decisions. Focus development on changes that give critical stakeholders the clearest insight.
Plan Safe Changes With Versioning and Rollback Options
Never push updates to a live environment without a safety net. Use version control to track changes and restore an earlier state if errors occur. This disciplined approach protects users from unexpected disruptions during improvements.
Reassess Infrastructure as Data Volume Grows
As your organization grows, more data will flow into your system. Test your infrastructure regularly to handle higher loads without losing performance. Proactive scaling prevents slowdowns and keeps needed insights available to your team.
Conclusion
Successful real-time business intelligence dashboard development needs more than clean code and attractive charts. It also requires each metric to support your core business goals. Clear visuals and useful alerts help your team make smart decisions quickly.
Your work continues after the dashboard goes live. Effective dashboard maintenance supports your data strategy, while governance, security, and careful testing remain ongoing duties, not one-time tasks. Regular user feedback keeps your tools useful as your company grows and market conditions change.
Stay curious about how your colleagues use these insights. A culture of continuous improvement can turn static reports into dynamic assets that guide your organization toward success. Keep refining your approach so your data remains a reliable compass for every strategic move you make.